Lesson 2 - Collecting and displaying data
Objectives
- Understand how to collect data
- Learn how data is represented by records and fields
- Practice exploring data in Google Sheets
Concept
How to collect data
We now can build on our definition of data as a fact that is attributable to something and that can be compared by thinking about how to collect data. The process of collecting data simply involves making a record of the facts that we want to use later on. Before we start collecting data, there are some important things to think about:
- What is the main object that we are attributing the facts to – a person, a country, etc.?
- What facts do we want to collect?
- How will the facts be compared?
Let’s look at each of these individually to help see the importance of thoughtfully collecting data. After that, we’ll walk through a few examples of collecting data to see the questions in action.
What is the object we are interested in?
It is best to start with the object of our data as that will then help us answer the other questions. In figuring out the object of our data collection, we want to think about what is the main object that we are looking to analyze. If it is a person, then we can think about what specific attributes related to a person that matter to us in what we’re trying to accomplish. If it is a country, then we can think about attributes that are related to a country.
It is possible to have multiple objects that are related that you want to attribute facts to. There could be different layers that you want to group together. A simple example would be countries and cities. You want to collect data about cities, but you also want to keep track of what country a city is associated with. While the country could be considered another piece of data about the city, it is better to think about it as another part of the object that you are collecting data about.
What facts do we want to collect?
Once you have the object identified, then you can move on to the facts that you want to collect. In some respects, this is the simplest question because you can brainstorm all the various items that are interesting for you. You can think of the various attributes for an object that are relevant and keep track of them as you will use them when collecting data. If you are collecting facts about human beings, you can collect information about their hair color, eye color, whether they were glasses or not, their height, and so on.
How will the facts be compared?
The final question helps to shape the facts that you want to collect. After you have the list of facts that you are interested in collecting, you want to make sure you know how you will assign the facts as you collect them. Here is where you start to define how you will measure and collect facts.
If you are collecting data regarding weather, are you going to collect the type of weather – windy, sunny, rainy, cloudy – for a given time period or will you collect a specific quantitative measurement such as temperature or wind speed? One way to think about this is that you have to note down what are the types of values you will collect for each fact. Or more specifically, you can establish a range of possible values for a given fact.
It’s time to look at some examples to help us understand all of this better.
Example: Countries

Let’s go through an example of collecting data about countries of the world. The object that we will be collecting facts about is a country. Next we want to consider what facts about countries that we want to collect. Possible facts to collect include:
- Population
- Size in area
- Flag
- Largest city
- Government type
- Languages
- Literacy rate
For each of these, we can now consider how we would compare the facts between countries. For example, the population of one country can easily be compared to the population of another country because they are both numbers. However, when we consider the flag of a country, that is more difficult to compare to another country. We would have to collect certain attributes about the flag, the number of different colors or a list of all colors or event specific characteristics like if the flag has stripes or stars. Those attributes wouldn’t be compared as you would compare a number but could be compared in terms of grouping countries by what colors they have in their flag.
Now think about how we could compare the largest city between two countries. The name of the largest city in two countries is not easy to compare, so that would not be a good fact to collect about a country even if it is interesting to know.
In general, when we think about what we want to compare for facts, we can group them into numbers or categories. In thinking through how to compare the facts of a country, it will help us define what data we actually want to collect. Here is an example of a few of the country facts along with how we can compare them and then what to collect:
| Fact | What to compare | What to collect |
|---|---|---|
| Population | Number | Total number of people |
| Size in area | Number | Total size in square kilometers |
| Languages | Number | Total number of languages |
| Flag | Category | List of colors |
When we organize the data that we have collected, it is best viewed as a table. A table will consist of individual objects with facts about each object as part of the table. Given the facts we want to collect, here is an example table of data about a few countries with some of those facts:
| Country | Population (millions) | Size in area (sq miles) | Flag colors |
| United States | 331.9 | 3.797 | Red, white, blue |
| Brazil | 214.3 | 3.286 | Green, yellow, blue |
| Spain | 47.42 | 0.16 | Red, yellow |
| Thailand | 71.6 | 0.20 | Red, white, blue |
When there is a table of data, there are a couple ways to analyze it. One is to analyze it by row; in this case, a row would be a specific country like the United States or Brazil. Or we can analyze it by column; in this example, a column would be population or flag colors. In general, a row represents a record of data about an object and a column represents a field which contains a fact about the objects.
Practice: Animals in Google Sheets
Accessing the template
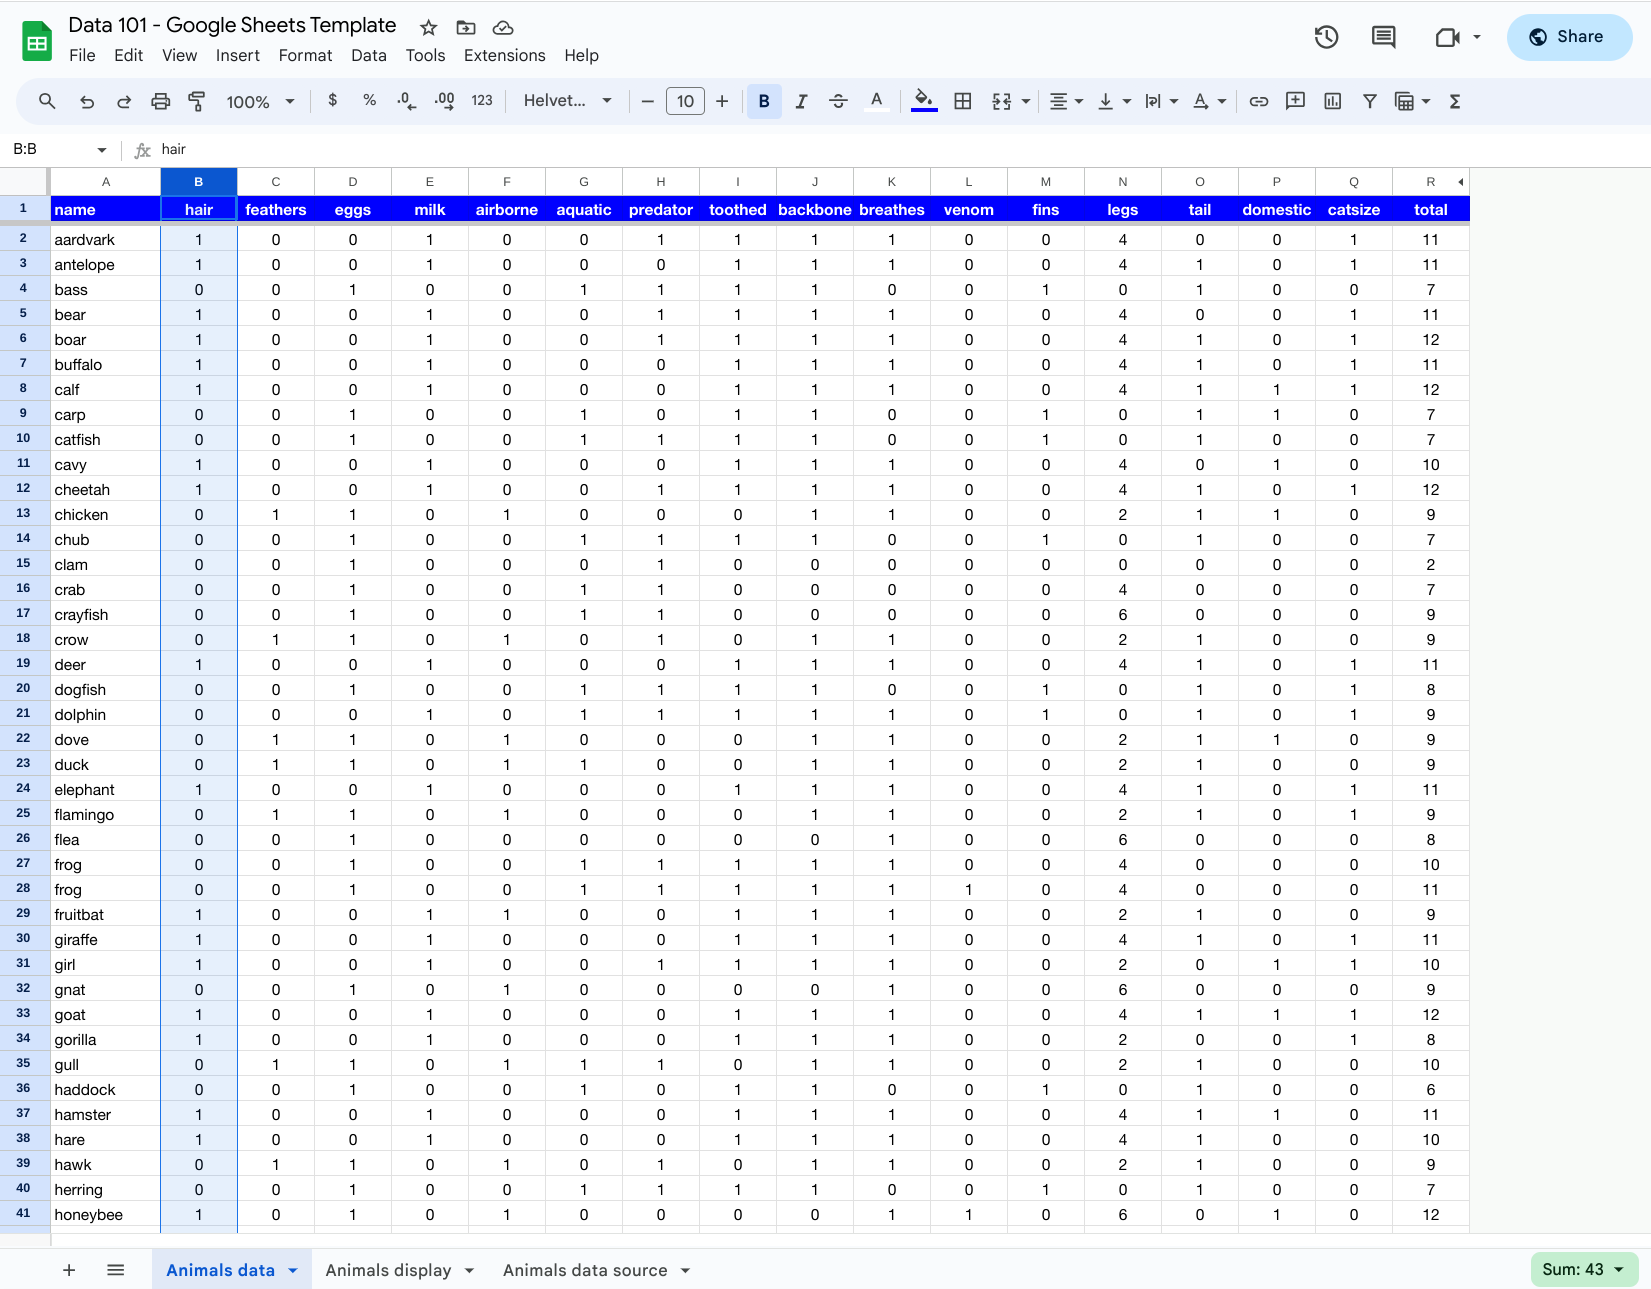
We can now work with an actual set of data to compare and analyze different attributes. We will be using an animal data set that has 101 animals and various attributes about them. To find the data, you can go to this link which is a Google Sheets template: link.
After opening the link, you will want to save your own version of the Google Sheets file by going to File -> Make a copy from the menu and you can rename it to whatever you would like.
Exploring the data
To explore the data, let’s start by looking at a few fields which are represented as columns. Each field represents an attribute for the animals. If you select Column B by clicking the B at the top of the column, you will see a Sum: 43 show up in the bottom right part of the Google Sheet. That represents summarized information about the field that you have selected. The value of 43 indicates that there are 43 animals that have hair.

If you continue to look at other fields in the columns, you will see that the majority of them have values of 0 or 1. Those fields represent yes or no characteristics where a 1 indicates the animal has the attribute and a 0 indicates the animal does not have the attribute. These types of characteristics are also known as Boolean (true or false) or binary (0 or 1) attributes.
If you scroll to the right, you will see a field called legs. That field is not a Boolean or binary attribute since the values range from 0 to 8. The last field on the right is total which was added by summing up the values of all the attributes.
Displaying the data
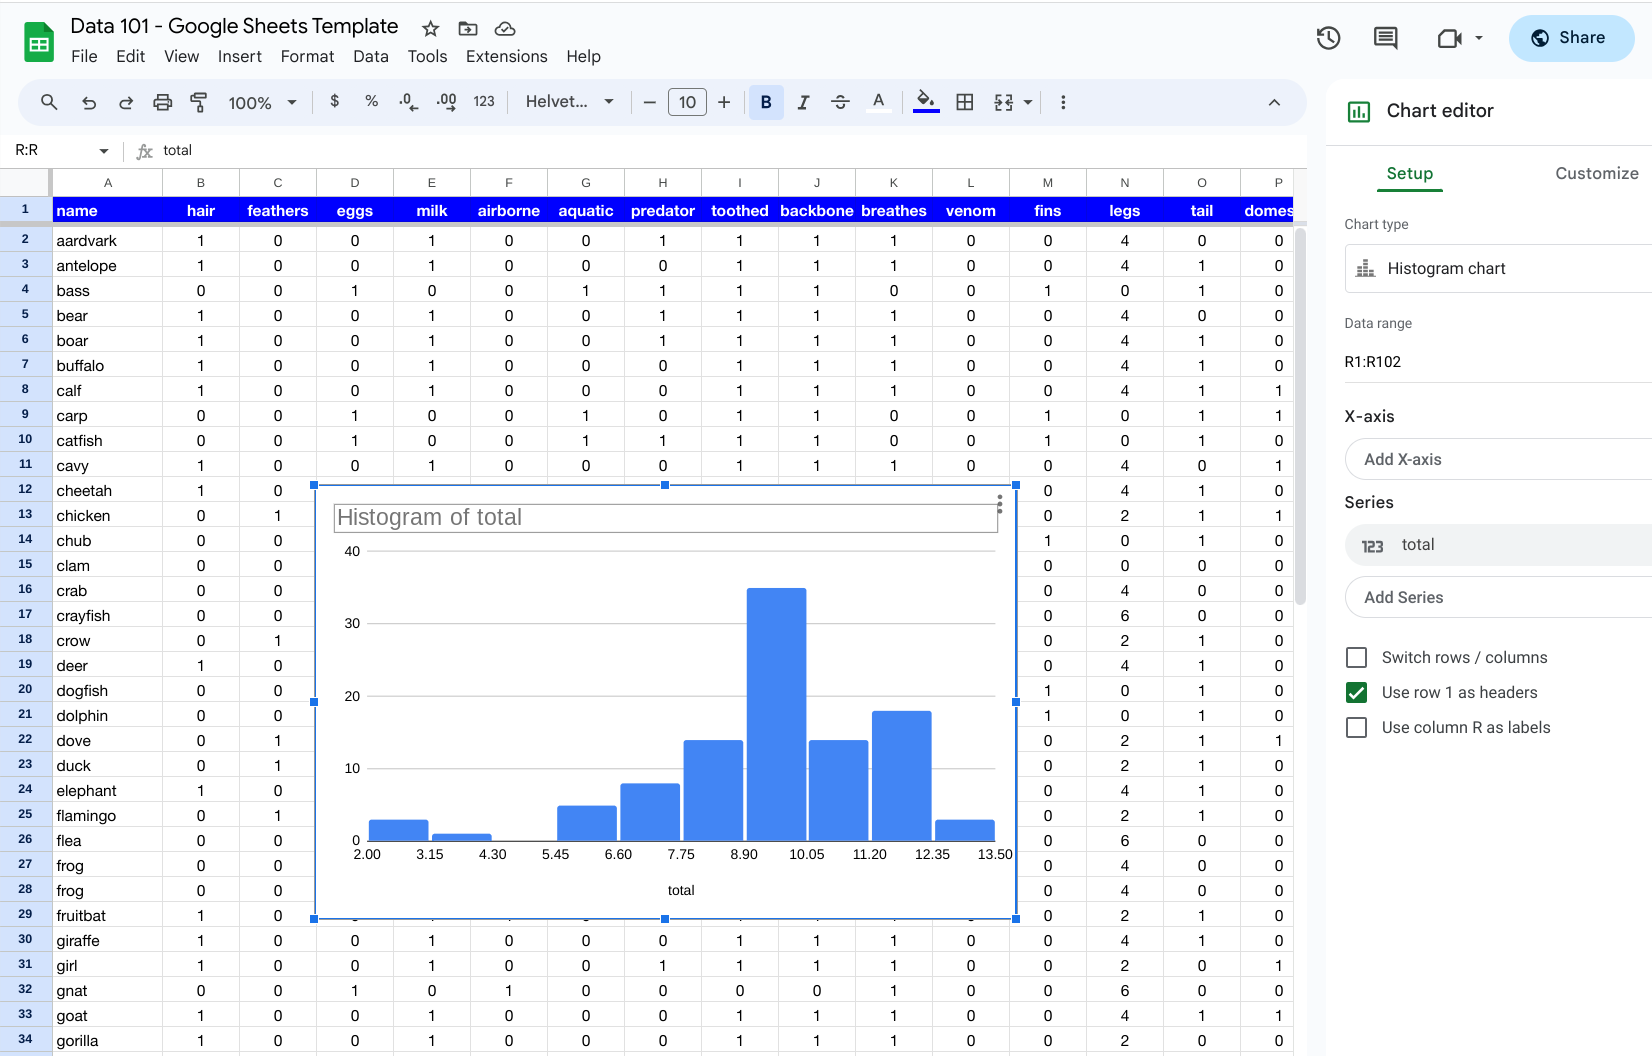
We can take our exploration a step further by displaying the data. To create a chart in Google Sheets, you first need to select the data you want to display. For a simple example, let’s select the total field (which is Column R in the Google Sheet). After that is selected, go to the menu at the top and navigate to Insert -> Chart. Once you set the Chart editor menu on the right, select the Chart type to be Histogram chart.

The chart shows us a breakdown of total attribute values by how each value. You will notice that the highest part of the histogram chart shows around the values of 9 and 10.
Practice: Collect Your Data
For an activity to collect data, you will want to go to your room (or think about what is in your room if you are at school) and collect data about what you have. You can think about how you would want to organize the data about your room in different ways. You can keep of count of types of objects in your room – clothes, toys, pictures, clothes, etc. Or you can also add attributes for objects in your room such as color or size.
The output should be a set of records with fields representing what is in your room. Each object would be its own record in your data.
Summary
When collecting data, you have to consider the main object that you are collecting data for and then what specific facts or attributes about the object that you want to collect. When data is collected, it is usually represented as a table consisting of records – where each object is a record – and fields – where each attribute about the object is a field.